What Is Bull Flag In Crypto And How To Identify It

✍️ 28 March, 2023 - 4:59 👤 Editor: Jakub Motyka

- A bull flag in crypto is a trading chart pattern signifying a trend continuation.
- Should you buy an asset when you see a bull flag? Below we answer that and much more.
- The latest news about cryptos is on our Telegram channel.
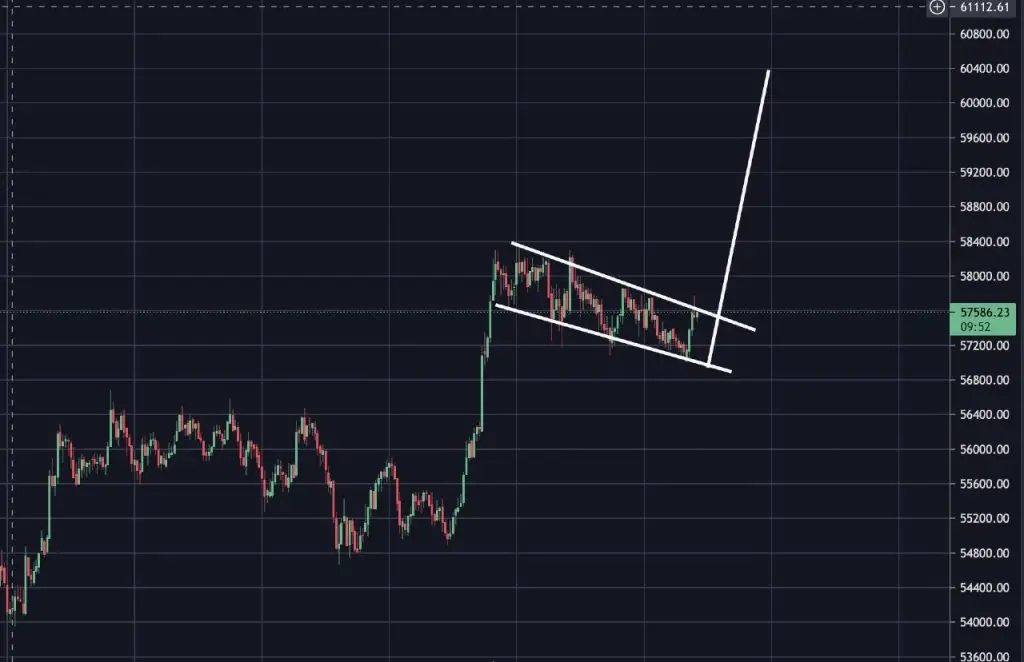
A bull flag in crypto is a chart pattern comprising a price rally, a brief consolidation, and another rally. The consolidation is a pullback with parallel upper and lower trendlines. The pullback is often because of profit-taking by investors.
Bull flags happen in an upward-trending market, and what investors need to know to profit from such market behavior is the exit point or the extent to which the trend will end.
What Does A Bull Flag Signify
The bull flag is shaped like the cloth used to symbolize a country with a pole. In simple terms, the flag signals a continuation of a trend – either downwards or upward, in the case of the bull flag. When it occurs in an uptrend, the price will likely continue going up.
But in a normal market, that is not always the case – as seen in what is often referred to as a false breakout – where the price breaks above the resistance (for a bull flag) and reverses shortly, liquidating poor strategies. To avoid such a case, experts recommend that investors look out for bullish price confirmation signals like a candlestick closed outside of the flag to confirm a bullish breakout.
Calculating The Target Price In A Bull Flag
So how do you calculate the target price in a bull flag? The price usually resembles length of the pole whenever a bull flag breakout occurs. To arrive at the target price, add the pole height to the breakout price, where the pole height is the pole high less the pole low.
Bull flags signify that the market still supports higher prices – meaning the bulls are in control – and could present a buying opportunity where investors can benefit from the next bull market. However, it is not always the case. A perfect bull flag may still yield a different result, a trend reversal for that matter, because of low volumes.
Traders need to check the volumes before opening a trade at the pullback of the flag pattern. Besides the volumes, other guiding momentum indicators are the Relative Strength Index (RSI) and Moving Average Divergence Convergence (MACD).
More crypto articles:
- Bitcoin's Bull Market To Be Confirmed In Less Than A Week
- Coinbase calls on developers to build inflation-linked stablecoins
- Is Dogecoin (DOGE) Dead In 2023?

ES: Jared Kirui es un escritor financiero experimentado apasionado por todo lo relacionado con la tecnología blockchain. Anteriormente, estuvo en los mercados bursátiles y forex, brindando a los administradores de activos contenido de primer nivel. Con un don para producir artículos de alta calidad, comenzó a cubrir noticias crypto en 2021. Tiene una mente abierta, comercia por diversión y disfruta de los deportes.
- What Is Crypto Copy Trading - 28 de March de 2023
- What Does Bitcoin FUD Mean - 28 de March de 2023
- What Is Bull Flag In Crypto And How To Identify It - 28 de March de 2023
🎁 Nuestro partner te regala 15€ por comprar criptomonedas:

Leave a Reply