Bitcoin (BTC) Rainbow Chart Shows $100,000 Price Prediction

✍️ 18 October, 2022 - 17:40 👤 Editor: Jakub Motyka
- According to the popular Bitcoin Rainbow chart, the price of BTC could touch $100,000 by 2025.
- The rainbow graph was designed by the CEO of Holger using logarithmic regression. What do the color bands mean? Is it really reliable?
- The latest news about cryptos, in our Telegram channel.
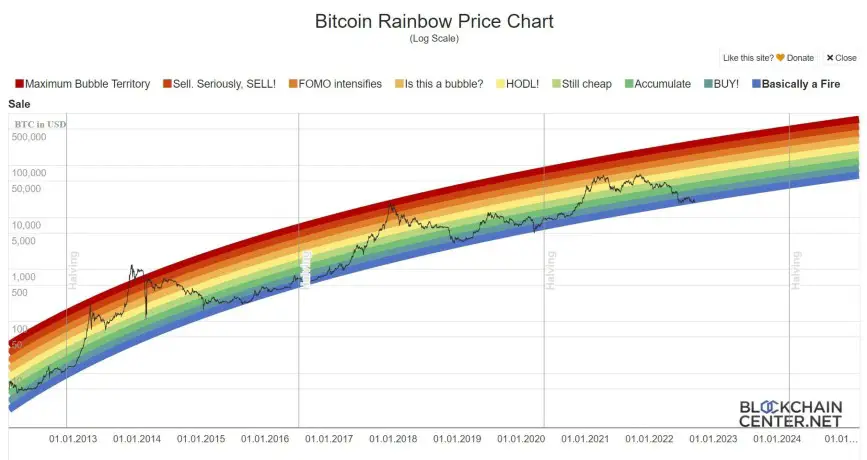
According to the famous Bitcoin rainbow chart, the prediction says that the price of BTC could reach USD 100,000 or more by 2025. If you have searched for models and predictions about the price of Bitcoin and cryptocurrencies, you have surely seen it. It is a predictive model in the form of a rainbow, which shows a logarithmic growth curve indicating the possible evolution of the BTC.
Bitcoin's rainbow chart was designed by Über Holger, CEO of Holger, using a logarithmic regression introduced by a Bitcointalk user in 2014. However, Holger himself admits to placing the bands of colors in a totally arbitrary way and without any scientific basis. Interestingly, the evolution of the value of BTC has followed the graph perfectly, to the point of being considered as a reliable predictive model.
What Are The Bitcoin Rainbow Chart Predictions?
Continuing with the graph, the price of Bitcoin is at the best point of purchase for those who want to take advantage of the next rise. In this way, the prediction says that Bitcoin (BTC) could reach USD 100,000 in early January 2025, after entering an accumulation stage or green band.

It should be noted that according to this model, Bitcoin could reach USD 700,000 that same year, in one of the most optimistic scenarios of all. To do this, it would have to reach the red zone called "Maximum Bubble Territory". This has already been conquered several times, during the uptrend of 2017 and 2014.
What Do The Experts Think About The Bitcoin Rainbow Chart?
Despite its popularity and curious accuracy, the rainbow chart should not be treated as a predictive tool, as it lacks a scientific basis. According to Twitter user Eric Wall, the rainbow model is better than the Bitcoin's popular Stock-to-Flow. However , he points out that it is still one more tool to "meet people's demand for a colorful lunar forecast".
As a side note, the original Holger chart was missing the last indigo colored band, labeled 1BTC=1BTC. This was added after the price briefly broke out of ranges during the 2020 dip.
More crypto news:


Leave a Reply